
Satellite analysis service guide
How to set up and use satellite analysis in Agdir Farm
1. Add a Field
Register your field by selecting “Add Field.” You can draw the field directly on the map or upload a shapefile.zip. Afterward, click “Set Crop” to enter general information such as:
• Crop type
• Sowing date
• Location name (you can rename your field here)
• Location type: choose between Field or Turf
• Proximity to water: indicate whether the field is near a water source
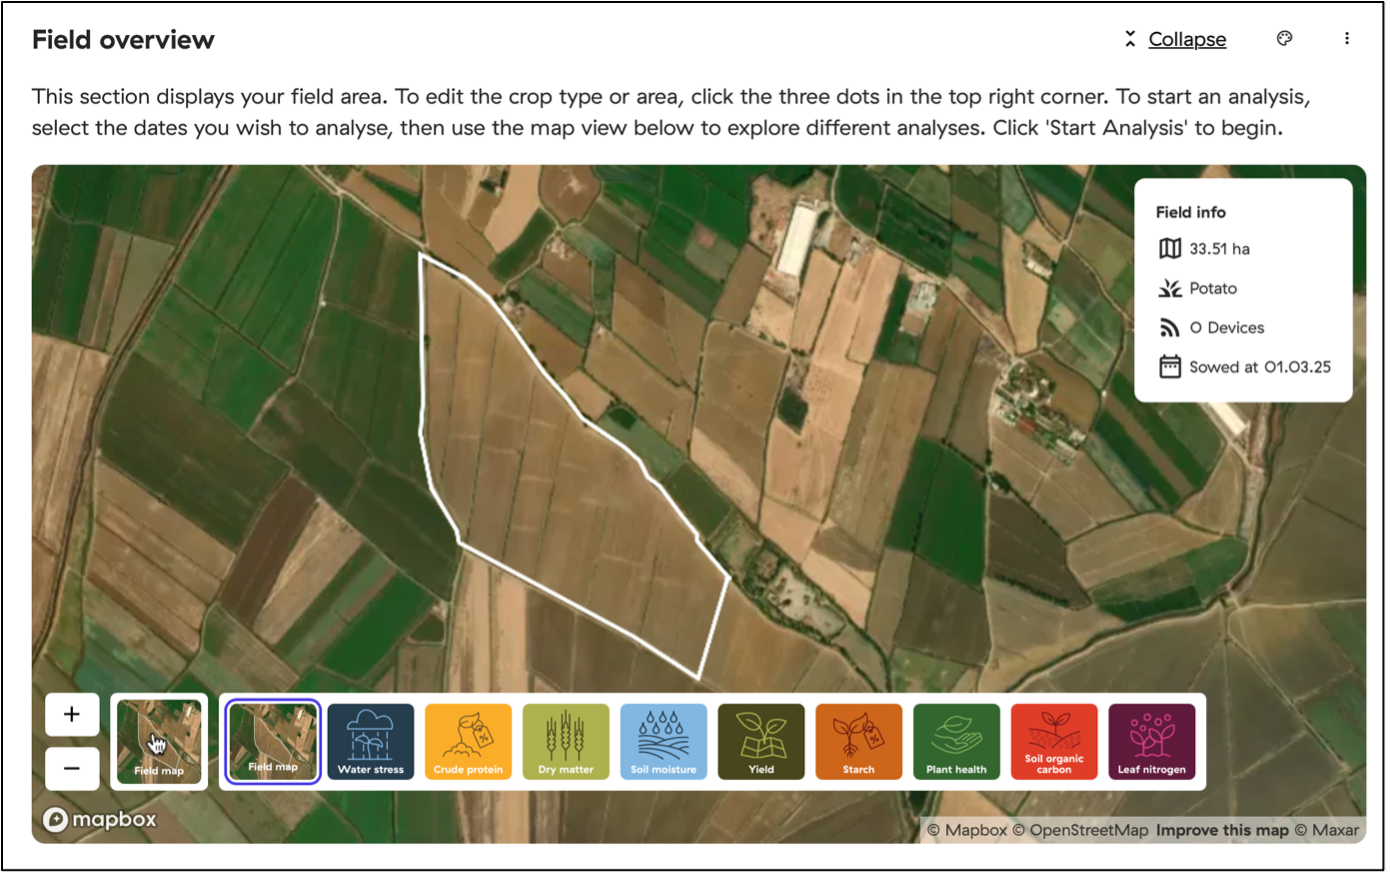
2. Field overview
This section displays your field area. To request satellite analysis:
· Click “Field Map” (bottom left).
· Select the desired analysis service.
· Specify the time period for the analysis request.
3. Satellite analysis services
Plant heath

The plant health service helps assess the overall growth health of your crops using the Normalized Difference VegetationIndex (NDVI), which ranges from 0 to 1. NDVI is derived from Sentinel-2 satellite imagery.
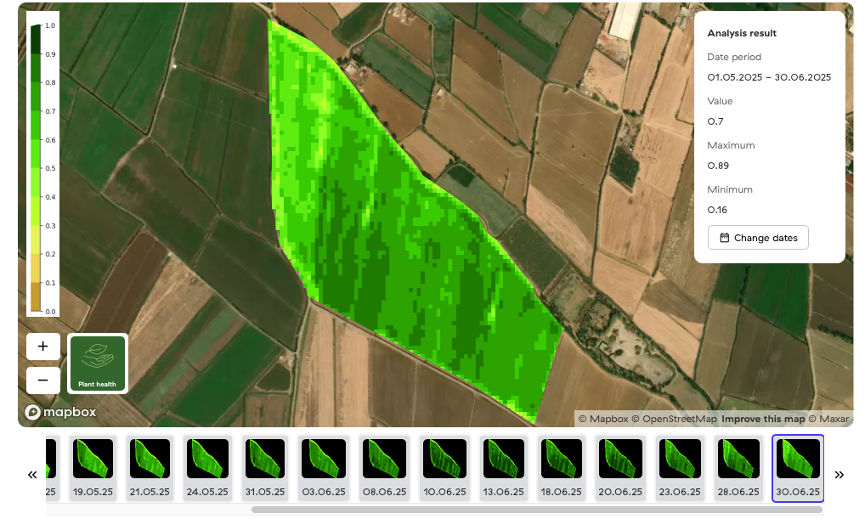
• 0-0.2: bare soil or very sparse vegetation (e.g., just after sowing).
• 0.2-0.4: low vegetation density, young or stressed crops.
• 0.4-0.6: moderate vegetation, crops are growing and developing.
• 0.6-0.8: dense vegetation, crops approaching full canopy.
•0.8-1.0: Very dense, healthy crops, peak growth.
Low NDVI areas within the field during the growing season may indicate problems such as water stress, nutrient deficiencies, or disease, allowing you to take corrective action early. You can also enable daily estimation while request the service. Using our specialized algorithm, we fill in the gaps between available satellite images to provide daily plant health maps.
Water stress
The Water Stress service helps assess the hydration and water status of your crops using the Normalized Difference WaterIndex (NDWI), which ranges from 0 to 1. NDWI reflects the water content of the vegetation present in the field, so readings are most accurate once crops have established and cover the field sufficiently. NDWI is derived from Sentinel-2 satellite imagery.
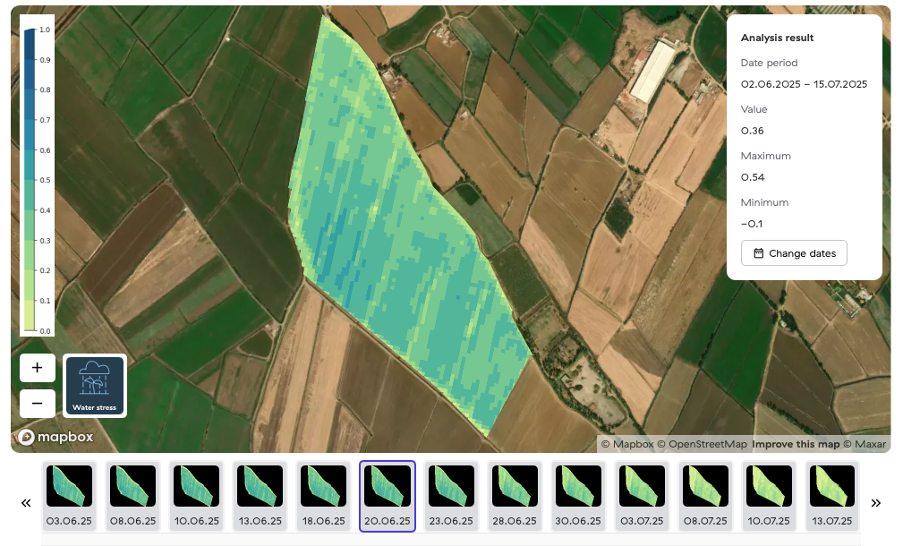
Typical NDWI values and their interpretation:
• 0-0.2: very low water content, crops may be severely stressed or dry (or vegetation is sparse)
• 0.2–0.4: low water content, mild water stress or young/early-stage crops
• 0.4-0.6: moderate water content, crops are adequately hydrated
• 0.6-0.8: high water content, crops are well-hydrated
• 0.8-1.0: very high water content, crops are fully hydrated
Low NDWI values in parts of the field may indicate water stress due to drought, irrigation issues, or uneven water distribution. However, for early-stage or sparsely vegetated fields, low NDWI may simply reflect limited canopy cover rather than true stress.
Soil moisture
This analysis allows growers to assess the soil moisture status of the top layer of the field when it’s bare soil or early growing stage of crops in the filed. This service is derived from sentinel-1 imageries. The map shows relative moisture across the field, so comparisons between areas or over time are most useful for management decision.
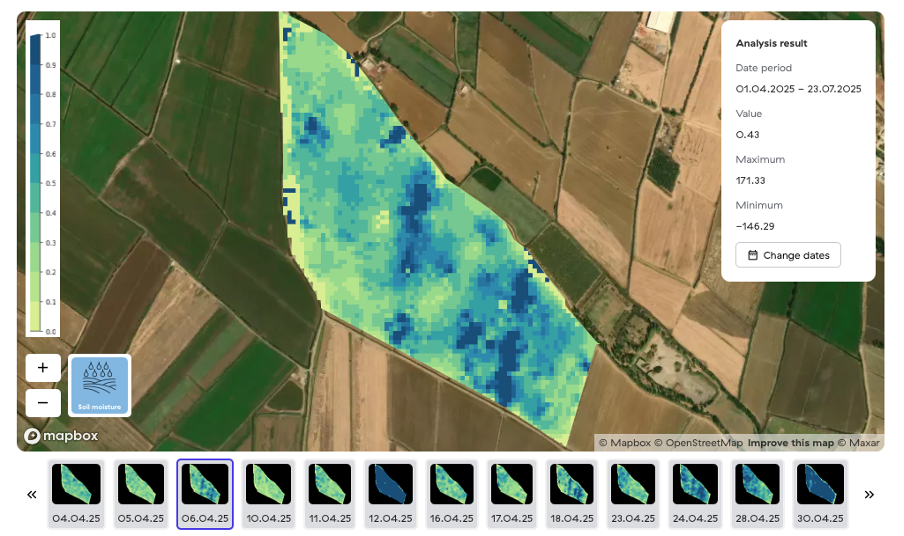
The soil moisture values range from 0 (completely dry) to 1 (saturated), representing the relative volumetric water content of the top 5 cm of soil. Interpretation depends on both the value and the field conditions:
· 0-0.2, very dry, soil has minimal water, crops may experience stress if this persists.
· 0.2-0.4: low moisture, soil is dry, irrigation may be needed for optimal crop growth.
· 0.4-0.6: moderate moisture, soil is adequately hydrated for most crops.
· 0.6-0.8: high moisture, soil is well-saturated, good water availability for crops.
· 0.8-1.0: very high/saturated, soil may be waterlogged, which can affect root growth.
Soil organic carbon
The Soil Organic Carbon (SOC) service provides an estimate of the carbon stored in the organic matter of your soil based on sentinel-2 satellite imageries.
The organic matter comes from plants, animals, microorganisms, and other living material that naturally enrich the soil. SOC is a key measure of soil health and fertility. Soils rich in organic carbon hold more nutrients, retain water better, and support healthier, more productive crops. Beyond helping your fields thrive, SOC also contributes to reducing carbon dioxide in the atmosphere, making it important for both agriculture and the environment.
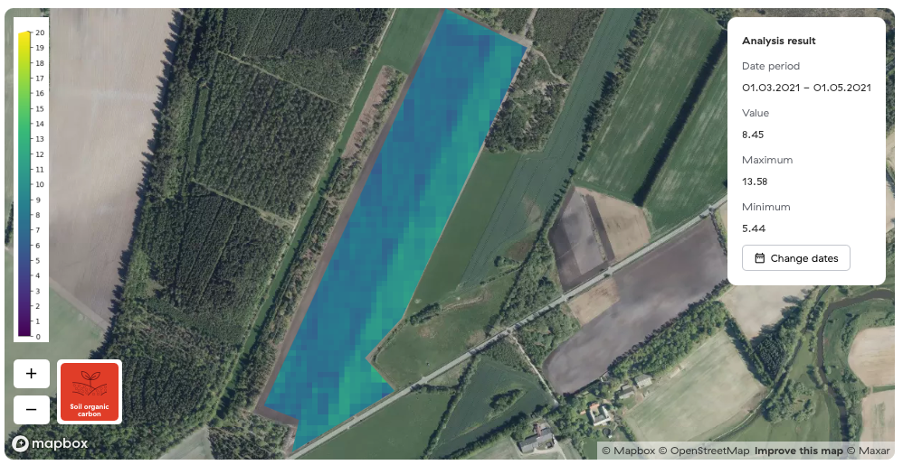
This analysis estimates SOC in the top 0–10 cm of soil, expressed in grams carbon per kilogram soil (g/kg). The model uses AI neural networks to process SOC data over a 13-month period on bare soil and generates a single image representing the average SOC for that timeframe.
Dry matter (forage grass)
The Dry Matter (DM) service estimates the portion of plant material that remains after all water has been removed, expressed as a percentage (%) of total plant weight. It reflects the nutrient density of forage grass and is essential for managing grazing, feed planning, and livestock nutrition. Sentinel-2 satellite imagery was used for this service.
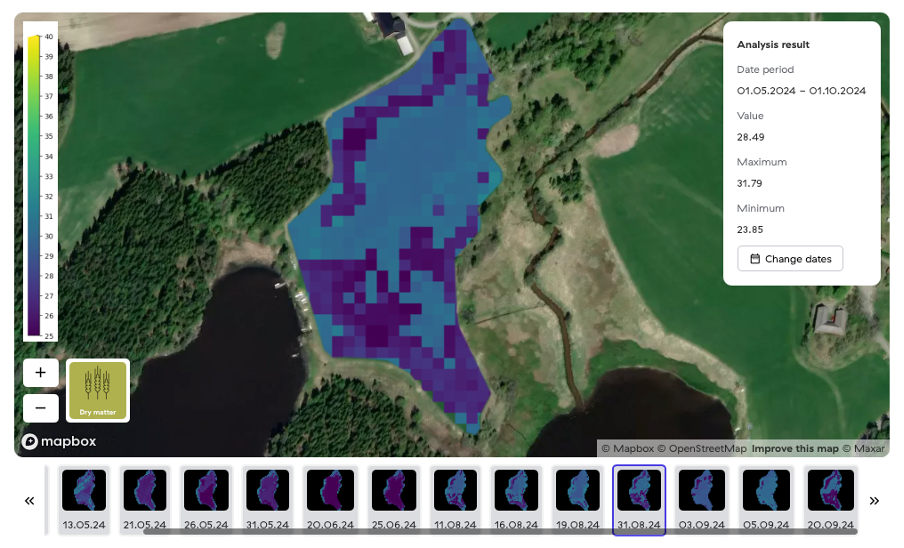
Typical DM values and their interpretation:
• 10-20%: low DM, forage is very wet, young, or recently grown; nutrient density is low, and animals may need to consume more to meet dietary needs.
• 20-35%: moderate DM: Forage has balanced moisture and nutrients; suitable for grazing or partial harvest.
• 35-45%: high DM, forage is mature and nutrient-dense; suitable for cutting or ensiling, but less digestible at higher end.
Monitoring dry matter over time helps farmers plan harvests, manage grazing schedules, and optimize feed quality, ensuring livestock receive the right nutrients for growth and production.
Crude protein (forage grass)
Crude protein (CP) represents the total protein content in plant material, expressed as a percentage of the forage’s weight. The term “crude” indicates that this measurement includes all protein forms and does not distinguish between protein types or their digestibility. The actual protein composition can vary depending on plant species, variety, growth stage, and environmental conditions. Sentinel-2 satellite imagery was used for this service.
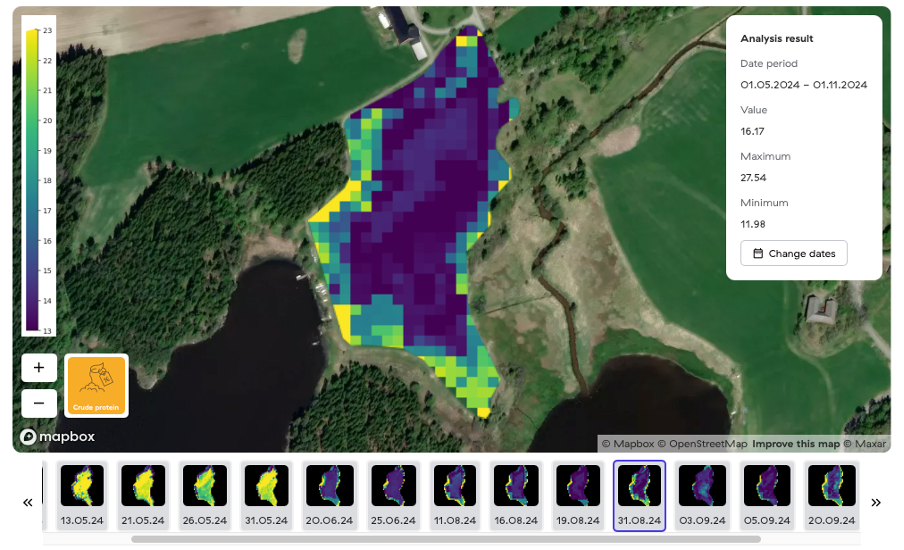
Typical CP values and their interpretation:
• <10%: low CP, very mature or nutrient-deficient grass (often late-season or drought-stressed); insufficient for most livestock without supplementation.
• 10-15%: moderate CP, typical of mid-maturity pasture; suitable for maintenance or moderate production (e.g., dry cows, beef cattle).
• 15-20%: high CP, lush, young, actively growing forage with good soil fertility; ideal for lactating dairy cows or fast-growing stock.
• >20%: very high CP, extremely young grass or grass-legume mixtures; excellent protein content but often low in fiber, which can limit rumen efficiency if fed alone.
Monitoring crude protein helps farmers plan feeding strategies, balance diets, and optimize livestock nutrition, ensuring animals receive the protein they need for growth, production, and overall health.
Yield (Potato)
Potato cultivation plays a vital role in the global food system, serving as a staple crop for millions of people worldwide. Yield maps provide valuable insights into field performance by identifying areas with both high and low productivity. This information helps guide fertilization, irrigation, and crop management decisions to improve overall efficiency and output.
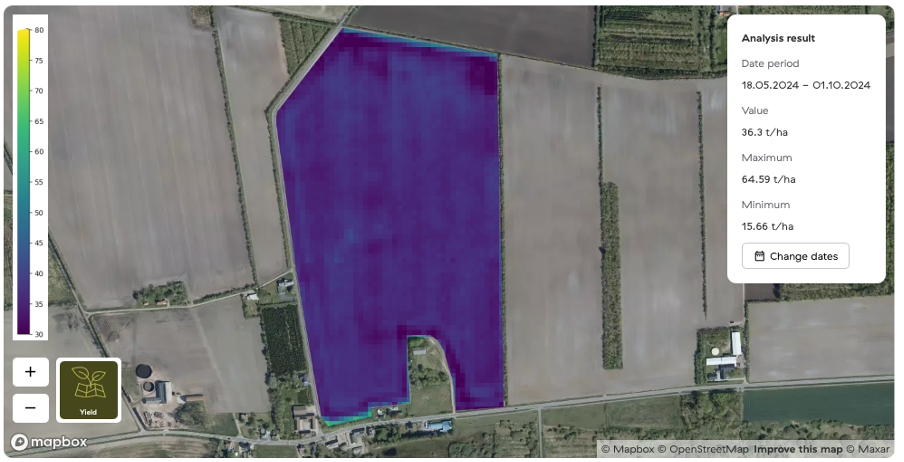
The yield model integrates satellite imagery and weather data to generate accurate and timely estimates of potato yield. Using time-series NDVI values derived from Sentinel-2 imagery together with daily temperature data, the model calculates the crop’s Net Primary Productivity (NPP), which is an indicator of biomass accumulation throughout the growing season. By aggregating NPP from planting to harvest, the model produces detailed yield prediction maps that reflect spatial variations across the field.
This satellite-based method provides a reliable, scalable, and cost-effective approach to predicting yields, offering practical benefits for both growers and agricultural companies involved in potato production and planning. The analysis results include field-level yield statistics, providing the average, maximum, and minimum yield values. Since the yield model was developed from Kuras trial data, variety-specific calibration may be needed to ensure accuracy.
Starch (Potato)
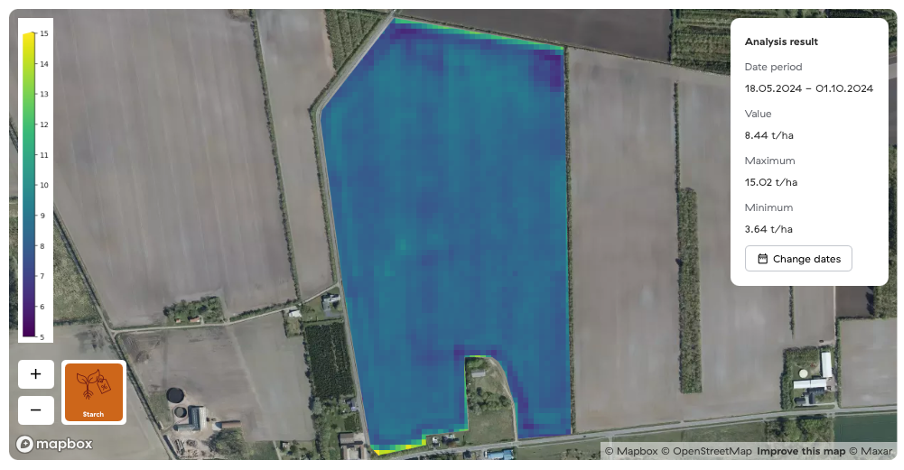
This service provides growers with real-time data on the starch yield of their potato fields. The service allows growers to easily monitor their starch levels and make informed decisions to achieve better production results and maximize their profits. Calibration by variety is required, as starch content can vary significantly between different potato cultivars.
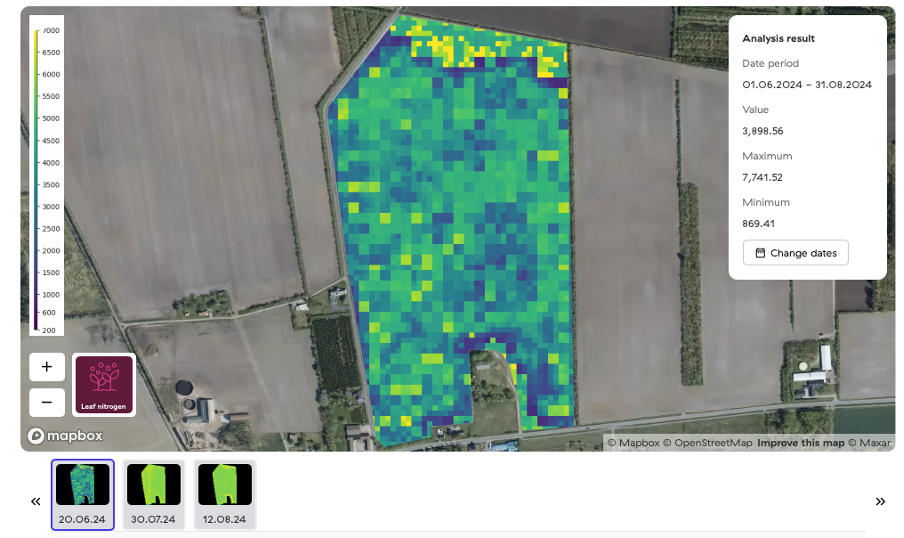
Leaf nitrogen (Potato)

The Leaf Nitrogen Service provides farmers and agronomists with a clear, field-scale view of crop nitrogen status using advanced satellite analytics. By using Sentinel-2 multispectral imagery and vegetation indices sensitive to chlorophyll and canopy structure, the service delivers reliable insights into how nitrogen levels vary across each field during the growing season. The service provides an assessment of the amount of nitrogen (ppm) available in the leaf of a potato plant.
General guidelines for potato leaf nitrogen content in ppm nitrate-N:

Satellite-based results can be influenced by cloud cover and the spatial resolution of Sentinel-2 imagery, which may limit detection of very small variations within fields. The service provides relative nitrogen estimates rather than direct laboratory measurements and should be used as a complementary decision-support tool within an integrated nutrient management strategy.